Visualize This
Research & Inquiry

Published September 11, 2017
Who knew that data visualization tools might be useful when analyzing patterns in handwriting to help date an ancient Syriac Christian manuscript? Or that visual software could be put to use to track and display the evolution of the boater hat in 19th-century and early 20th-century women’s fashion trends?
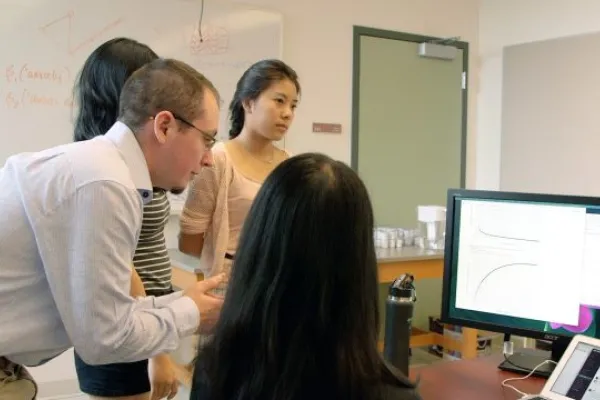
Indeed, the ability to observe, track and measure phenomena from human activity is a growing capacity in the digital world. In Smith’s human computation and visualization laboratory, visual analytics researcher R. Jordan Crouser ’08 is teaching his students how to tell important stories—and create innovative visual graphics, such as charts and interactive maps—using the complex data that emerges from the simple act of living. He stresses to his students—computer scientists as well as the philosophy and theatre majors—the importance of computational thinking skills, which are essential to the development of computer applications.
So students studying with Crouser, assistant professor of computer science, are learning not only how to deploy myriad data in service to their projects, but also how to collect, organize and present that raw data in ways others can easily understand. For example, Crouser helped students working on the boater hat project to create 3-D digital models of hats and an interactive website exploring the hat’s evolution.
“This is a pivotal moment in history with data,” says Crouser, who compares it to another critical time—before the advent of the printing press, “when being able to read was really a luxury.” It was an era when a huge disparity existed between those who had access to books and those who didn’t, as well as people who could read and people who couldn’t. “I think we’re starting to approach that same kind of seismic shift when it comes to programming and computational thinking in such a rapidly paced environment,” he notes.
“There really seems to be a big difference in terms of social mobility, in terms of job access between folks who have mastered the computational skills and people who havern’t.”
When defining the multidisciplinary research projects that he and his students will work on together each semester, he encourages students to choose research based on their own interests.
Ultimately, the ability to create rich visual displays to cut through data clutter in ways that others can understand is important to a project, Crouser says. “And if a student is bringing to me her own intrinsic motivation to pursue philosophy or mental health, or community action or social justice projects, all the better. We can do my visual analytics research in any of those contexts.”
Visual analytics researcher R. Jordan Crouser ’08, assistant professor of computer science, stresses to his students—the computer scientists as well as the philosophy and theatre majors—the importance of computational thinking skills.