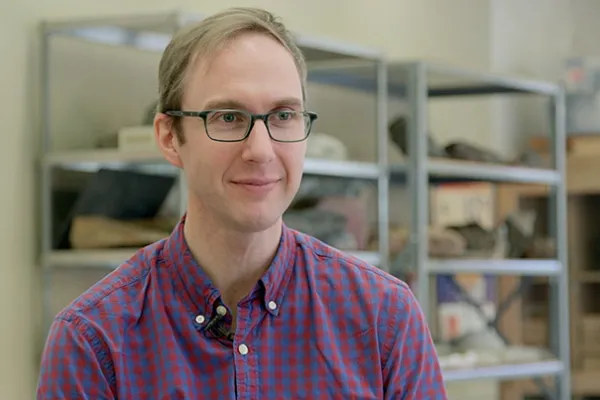
A New Kind of Mapping: Professor Introduces Students to GIS
Campus Life

Published December 18, 2017
It is a Monday morning in early December, and the 20 students in professor Jack Loveless’ Mapping Our World: Introduction to Geographic Information Systems course are clustered in small groups around computers and laptops in a Sabin-Reed Hall laboratory. The din of conversation is loud as students set about producing data-driven interactive maps for their various GIS projects.
Geographic information systems are designed to connect information to points on a map, says Loveless, an associate professor of geosciences. “The programs work by linking a lot of different data sets and drawing relationships between data sets by way of geography,” he says, likening the system to a layer cake, in which each new layer of information is displayed over preceding ones.
The resulting maps reveal the spatial relationships of the different data sets or other sets of information. “GIS is the software that really enables you to analyze those relationships,” Loveless says.
Cara Dietz ’19, Audrey Ring ’18 and Zoe Zandbergen ’18 are creating a web-based, interactive story map of some 90 prominent trees on campus using an ArcGIS spatial analysis software template. In the process, they have wrestled with organizing and consolidating an assortment of Word documents and MP3 and Excel files while building on TreeSpeak, a previous horticulture class project in which students identified campus trees and recorded short segments about the trees. These audio files are currently accessible by QR code at each tree.
By semester’s end, the three students hope to have a new interactive, web-based map that brings to life the shape of the campus landscape in which the trees thrive and provides additional information about each tree through new data sets such as photographs and text. Once completed, the map will be available on the Smith Botanic Garden website and accessible to online visitors to the Botanic Garden as well. [See video for more on the tree-mapping project.]
The tree project is one of six projects for which students are generating data-driven maps this semester. Among the others, Loveless says, are two projects associated with Smith’s Dining Services and the Center for the Environment, Ecological Design and Sustainability—one in which students are exploring where Smith’s food suppliers come from; the other in which students are mapping where food waste goes and showing how Smith can potentially enhance composting across campus. Another project is evaluating the efficacy of Smith’s efforts to manage invasive plant species on campus. For each project, students are working directly with community partners.
Two student groups are focused on working with the Kestrel Land Trust of Amherst to develop maps and identify the best places to install new trail signs along the Mount Tom and Mount Holyoke ranges; another group is partnering with Mass Audubon to create interactive story maps of stone walls for one of its properties in Williamsburg, Mass.
“This is my sixth year teaching this class,” Loveless says, “but this is only the third time that I’ve taught it with these community-partner-based final projects. From the very first time through, it was a big experiment. I didn’t know if it was going to work out well or not, but witnessing the students carrying out these projects and just seeing how engaged they were in doing this original work was really, really inspiring.”